Difference between revisions of "Manual:Extension/BlueSpiceExtendedStatistics"
| [unchecked revision] | [unchecked revision] |
Fbaeckmann (talk | contribs) m (Text replacement - "[[ExtendedStatistics" to "[[Reference:ExtendedStatistics") |
(Tag: 2017 source edit) |
Contents
- 1 What is ExtendedStatisticsBlueSpiceExtendedStatistics?
-
2 Where to find ExtendedStatisticsBlueSpiceExtendedStatistics?
- 2.1 Choose the database Choosing a data source
- 2.2 Choose a filter
- 3 Tips for working with ExtendedStatistics
- 4 Classical statistics with MediaWiki 5
- 3 See also
What is ExtendedStatisticsBlueSpiceExtendedStatistics?[edit | edit source]
ExtendedStatisticsBlueSpiceExtendedStatistics provides an analytic view of many relevant parameters on the wiki, providing wiki administrators better insight into functioning of the wiki.
Where to find ExtendedStatisticsBlueSpiceExtendedStatistics?[edit | edit source]
"Global actions", "Extended statistics": BlueSpiceExtendedStatisticsa special page accessible from Global actions menu in the left navigation.
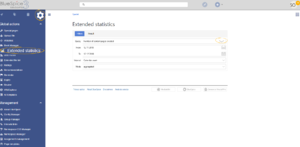
Choose the databaseChoosing a data source[edit | edit source]
Next, choose the database you want to useExtendedStatistics can show data for multiple aspects of the wiki. Available data sources are:
- Number of users: All the users that registered in the period chosen.
- Number of pages: All pages created in the period chosen. Namespace, linking and so on play no role here.
- Number of articlescontent pages: All articles which were in content namespaces created in the period chosen, lie in a content namespace and have at least one internal link. The numbers should conform with the article's MediaWiki statistics. Note: MediaWiki has changes the way it counts a little in Version 1.18. This can lead to slight discrepancies.
- Number of edits: All edits carried out in the period chosen.
- Edits per user: The quotient Number of "number of edits" and "number of users" in each interval is shown.
- edits per user in the period chosen
- Search queries: All terms users searched for in the period chosen. Only availble if BlueSpiceExtendedSearch is installed.
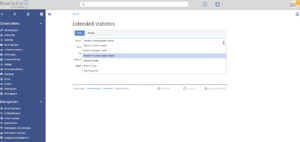
Choosing filters[edit | edit source]
Enter the settings you wantGeneral filters: Date range:
- Both data fields empty: No time restriction.
- From date empty: Starting from the earliest creation / edit / registration / search query.
- To date empty: Up to the present day.
Display:
- Resolution (Year, month (default), week, day).
-
Mode:
- Absolute: The actual numbers involved.
- Aggregate: The running total. This graph will always either rise or stay at the same level.
- As a list: The individual results will be shown as a sortable list.
Filter:
- Namespace: To choose several namespaces, hold down the CTRL key while clicking. No choice means that all namespaces will be considered.
- Category: No choice means the results will not be filtered according to category, and pages not assigned to a category will be included.
- Search space: Only for search query statistics. Enter which pages you want to be included in the statistics: Title, text, files, all.
Excluded users: Select all users that shall not be included in the statistics.
Tips for working with ExtendedStatistics- From - Date from which to display data
- To - Date to which to display data
Some data sources may have additional filters available, like for data sources based on wiki pages, namespace filter is availble.
Display settings[edit | edit source]
Carry out queries in small steps. If the server load is expected to be too high, you will be asked to minimise the steps. At the moment, a maximum of 366 steps (e.g. 366 weeks) can be entered. The maximum number will be set by the administrators in the preferences.
The list of search queries can be sorted according to the "number of results". Queries which do not yield any information are especially interesting. There is clearly some information missing in the wiki.
Classical statistics with MediaWiki[edit | edit source]
The statistics special page in MediaWiki has developed its own counting system. For example, an article or a content page will only be counted if:
- It is in the main namespace or a different separately determined namespace.
- It is not a redirect.
- It contains at least one internal link.
The way data will be displayed can be configured in the following aspects:
- Interval - grain of the diagram - determines which time of unit will be used to group the data
-
Mode - display type:
- Absolute - shows changes in data for the given period
- Aggregate - shows running total for the data source choosen
- List - shows data in tabular view - only avaiable for certain data sources
See also[edit | edit source]
Our reference .Further helpful information:
- mediawiki.org: Magic words
for this extension.