Difference between revisions of "Manual:Extension/BlueSpiceExtendedStatistics"
| [unchecked revision] | [quality revision] |
(Tag: Visual edit) |
Contents
ExtendedStatistics The extension ExtendedStatistics provides an analytic view of many relevant parameters on the wiki, providing wiki administrators better insight into the functioning of the wiki.
Where to find ExtendedStatistics?Contents
Where to find Extended statistics[edit | edit source]
"Global actions", "Extended statistics":
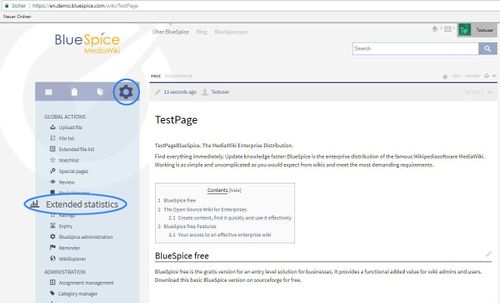
The navigation link Extended statistics in the tab Global actions loads the page Special:ExtendedStatistics.
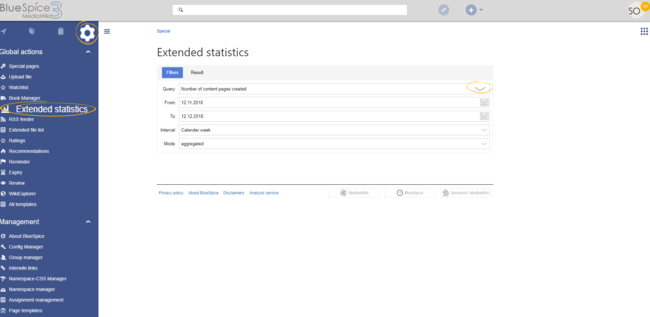
Choosing a data source[edit | edit source]
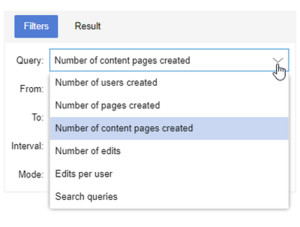
Next, choose the database you want to useExtendedStatistics can show data for multiple aspects of the wiki. Available data sources are:
- Number of users: All the users that registered in the period chosen.
- Number of pages: All pages created in the period chosen. Namespace, linking and so on play no role here.
- Number of articlescontent pages: All articles which were in content namespaces created in the period chosen, lie in a content namespace and have at least one internal link. The numbers should conform with the article's MediaWiki statistics. Note: MediaWiki has changes the way it counts a little in Version 1.18. This can lead to slight discrepancies.
- Number of edits: All edits carried out in the period chosen.
- Edits per user: The quotient Number of "number of edits" and "number of users" in each interval is shown.
- edits per user in the period chosen
- Search queries: All terms users searched for in the period chosen. Only availble if BlueSpiceExtendedSearch is installed.
Choosing filters[edit | edit source]
Enter the settings you wantGeneral filters: Date range:
- Both data fields empty: No time restriction
- From date empty: Starting from the earliest creation / edit / registration / search query
- To date empty: Up to the present day.
Display:
- Resolution (Year, month (default), week, day)
-
Mode
- Absolute: The actual numbers involved
- Aggregate: The running total. This graph will always either rise or stay at the same level.
- As a list: The individual results will be shown as a sortable list.
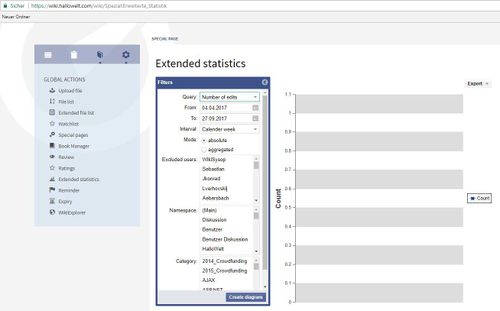
Filter:
- Namespace: To choose several namespaces, hold down the CTRL key while clicking. No choice means that all namespaces will be considered.
- Category: No choice means the results will not be filtered according to category, and pages not assigned to a category will be included.
- Search space: Only for search query statistics. Enter which pages you want to be included in the statistics: Title, text, files, all
Excluded users: Select all users that shall not be included in the statistics.
I will choose, for example, number of edits:
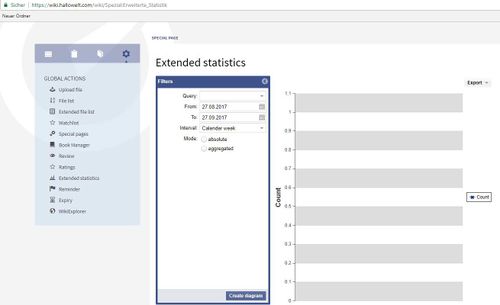
And "Create diagram":
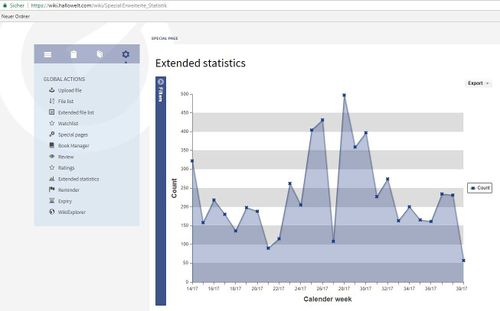
A graph is created matching the settings for the statistics you have made.
Note: Only valid data will be taken into account.
The time will be shown on the X axis, and the values on the Y axis.
Below the diagram, you will find a summary of your query.
Tips for working with ExtendedStatistics[edit | edit source]
Carry out queries in small steps. If the server load is expected to be too high, you will be asked to minimise the steps. At the moment, a maximum of 366 steps (e.g. 366 weeks) can be entered. The maximum number will be set by the administrators in the preferences.
The list of search queries can be sorted according to the "number of results". Queries which do not yield any information are especially interesting. There is clearly some information missing in the wiki.
Classical statistics with MediaWiki[edit | edit source]
The statistics special page in MediaWiki has developed its own counting system. For example, an article or a content page will only be counted if
- it is in the main namespace or a different separately determined namespace
- it is not a redirect
- it contains at least one internal link.
See also[edit | edit source]
Our
Further helpful information:
- mediawiki.org: Magic words
- From - Date from which to display data
- To - Date to which to display data
Some data sources may have additional filters available, like for data sources based on wiki pages, namespace filter is available.
Display settings[edit | edit source]
The display of the results is determined by the following settings:
- Interval - grain of the diagram - determines which time unit will be used to group the data.
-
Mode - display type:
- Absolute - shows changes in data for the given period
- Aggregate - shows running total for the data source choosen
- List - shows data in tabular view - only avaiable for search statistics
Note: Depending on the selected time period, the interval has to be set accordingly. For, example if you look for data between 02.06. and 03.06. for the same year, the interval setting "Year" will not return any data. Change the interval to "Week" or "Day" to return results.
Viewing the results[edit | edit source]
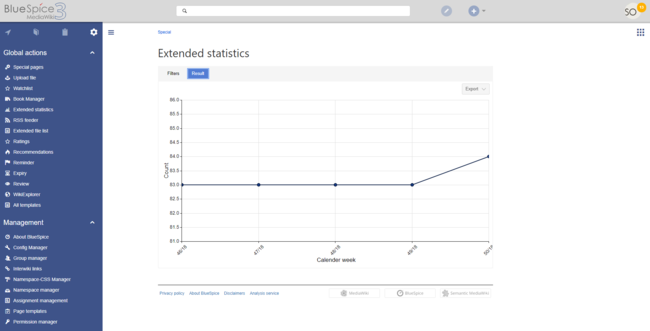
Once all the filters and options are set, click on the Results tab to show the resulting data.
Chart export[edit | edit source]
In results view there is an Export-button that allows the user to export and download the currently displayed chart as SVG.
Data export[edit | edit source]
Maintenance script[edit | edit source]
A php maintenance script will be provided on the following location:
<mw-root>/extensions/BlueSpiceExtendedStatistics/maintenance/ExportCollection.php
Usage[edit | edit source]
This script must be called on the command line of the server. It takes the path of a configuration file in JSON format.
Example
                php <mw-root>/extensions/BlueSpiceExtendedStatistics/maintenance/ExportCollection.php \
    --config=<path-to-file>/myConfig.json \
    --exportto=/tmp/myExport.xslx
Params
-
--config- path to config file -
--exportto- path to the file, the data gets exportet to. Note that vaiable file formats arexsl,xslxandcsv
Scirpt configuration[edit | edit source]
The script configuration will take the same parameters as the API, which is used on Special:ExtendedStatistics.
Params
-
aggregate -
filter
Example contents[edit | edit source]
The following examples show the content of the JSON file provided to --config.
"Page views" aggregated by date over 1 year
                {
	"aggregate": [
		{
			"property": "timestampcreated",
			"type": "daily",
			"targets": [
				"pagetitle",
				"numberhits",
				"numberhitsaggregated"
			]
		}
	],
	"filter": [
		{
			"property": "type",
			"type": "string",
			"value": "hitcounter",
			"comparison": "eq"
		},
		{
			"property": "timestampcreated",
			"type": "date",
			"value": "20200707120000",
			"comparison": "gt"
		},
		{
			"property": "timestampcreated",
			"type": "date",
			"value": "20210707120000",
			"comparison": "lt"
		}
	]
}
"Review by namespaces" aggregated by namespace over 1 year:
                {
	"aggregate": [
		{
			"property": "namespacename",
			"type": "string",
			"targets": [
				"ongoingpages",
				"expiredpages",
				"notrunningpages",
				"ongoingpagesaggregated",
				"expiredpagesaggregated",
				"notrunningpagesaggregated"
			]
		}
	],
	"filter": [
		{
			"property": "type",
			"type": "string",
			"value": "reviewedpages-ns",
			"comparison": "eq"
		},
		{
			"property": "timestampcreated",
			"type": "date",
			"value": "20200707120000",
			"comparison": "gt"
		},
		{
			"property": "timestampcreated",
			"type": "date",
			"value": "20210707120000",
			"comparison": "lt"
		}
	]
}
Configuration[edit | edit source]
In the Config manager, you can change the following settings:
- Exclude these users: Some user groups, like WikiSysop can skew the statistics, for example the statistics for search queries or because they complete automated maintenance tasks. These types of user groups can be excluded from the statistical results.
- Maximum number of interval steps: Sets the size of the x-axis for the results. For a few days, select the interval Day or Calendar Week, for periods over one year, select Year or Month. If you do not get any results for your query, try to adjust the interval accordingly.