Difference between revisions of "Manual:Extension/DrawioEditor"
| [unchecked revision] | [quality revision] |
(Tag: Visual edit) |
Summary[edit | edit source]
The extension Drawio Draw.io offers extensive illustration drawing possibilities for processes, complicated process flowcharts, and much moreinfographics and other visualizations on a wiki page. Descriptive graphics like process chains or decision trees can be constructed easily!
How to create flowcharts with Drawiodirectly on a wiki page.
Contents
Inserting a chart[edit | edit source]
Step 1: To insert a drawing with VisualEditor:
- Create or choose a page where you want to insert a
Step 2: Enter the following code at the desired spot:
Create links: Use DrawIO with ImageMap- drawing.
- Select Insert > Magic word from the editor toolbar.
- Choose drawio from the list of magic words.
- Click Done. This opens a dialog box. Enter a name for your drawing.
-
Click Insert.
This inserts the following tag in your source code
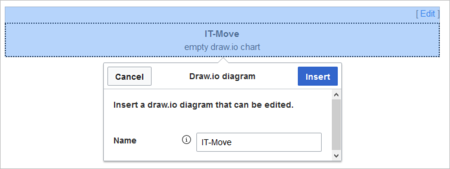
{{#drawio:Name_of_the_flowchart}}
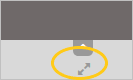
Step 3: After saving the article, you will now find an Edit link at the respective spot of the page. Click on it to open the creation mode for the flowchart.
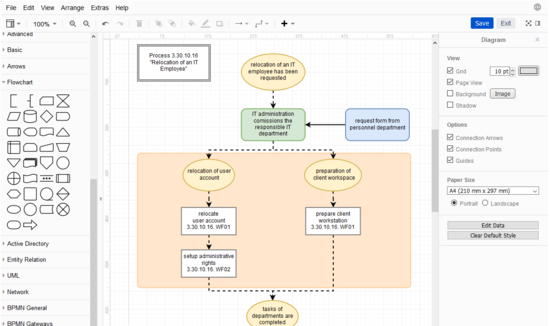
In the plugin you can now choose boxes, arrows, etc. on the left and insert and combine it on the right. Clicking Save will save your changes and the diagram on your wiki page will be automatically replaced.
By the way: there is also a Help tab where you can find a detailed user manual.
|
You can find more information on the Drawio homepage. |
- Save the page.
Editing the drawing[edit | edit source]
-
Click Edit on the saved page above the drawio placeholder to open the draw.io editor. For the best editing experience, set your wiki into full-screen mode using the toggle button in the main toolbar.You can now edit your drawing.
- Click Save in the draw.io window to save your drawing.
- Click Exit next to the Save button in the draw.io window to close the draw.io editor.
About PNG and SVG files[edit | edit source]
In BlueSpice, draw.io diagrams are always saved in PNG format. It is currently not possible to save diagrams in SVG formats. If you have installed your wiki in-house (i.e., you are not working in the cloud), you can activate SVG support via an additional extension.
Import of existing diagrams[edit | edit source]
Visio diagrams[edit | edit source]
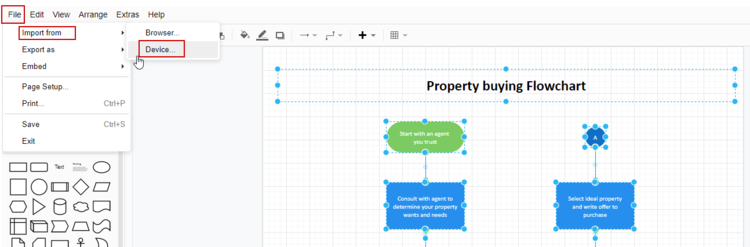
You can import files with the extension .vsdx directly into draw.io and edit them further. To do this, create an empty draw.io diagram on a wiki page. Save the empty diagram and then switch to draw.io's edit mode. From there, choose File> Import From> Device. You can then edit the imported diagram in draw.io.
SVG files[edit | edit source]
When you import an SVG file into the BlueSpice draw.io editor, it is automatically converted into PNG format and can, therefore, no longer be edited. It is also not saved as an SVG file in the wiki. As an alternative to importing it into draw.io, you should upload the SVG file to the wiki and embed it on a wiki page. The versioning of the file cannot be done directly in the wiki. The updated version of the SVG file would then have to be updated accordingly via the file page by uploading it again.
Using draw.io with image maps[edit | edit source]
DrawIO Draw.io creates a versioned png-file in the File namespace. This means that every change of the flowchart that was concluded by Save will create creates a new, updated version of this png-file. You can now integrate this file on another page in your wiki and use ImageMapEdit to link parts of it internally or externally to other pages.
Please note: unfortunately it or create an image map.
Note: It is not possible to use
|
More information about the use of ImageMaps can be found here. |
an image map on the same page as a drawio-diagram.