Page is a draft due to changes in included resources
You are viewing an old version of this page. Return to the latest version.
Drawio
-
- Last edited 3 years ago by Evi Vogel
-
-
- This page is a draft but has an approved version
Contents
Summary
Draw.io offers extensive drawing possibilities for process flowcharts, infographics and other visualizations on a wiki page. Descriptive graphics like process chains or decision trees can be constructed directly on a wiki page.

Inserting a chart
To insert a drawing with VisualEditor:
- Create or choose a page where you want to insert a drawing.
- Select Insert > Magic word from the editor toolbar.
- Choose drawio from the list of magic words.
- Click Done. This opens a dialog box. Enter a name for your drawing.
- Click Insert. This inserts the following tag in your source code
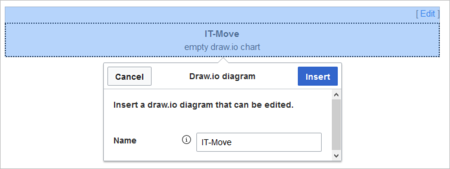
{{#drawio:Name_of_the_flowchart}} - Save the page.

Editing the drawing
- Click Edit on the saved page above the drawio placeholder to open the draw.io editor. For the best editing experience, set your wiki into full-screen mode using the toggle button in the main toolbar.You can now edit your drawing.
- Click Save in the draw.io window to save your drawing.
- Click Exit next to the Save button in the draw.io window to close the draw.io editor.
Using draw.io with image maps
Draw.io creates a versioned png-file in the File namespace. This means that every change of the flowchart that was concluded by Save will create a new, updated version of this png-file. You can integrate this file on another page in your wiki or create an image map.